Train activity by city
How busy are the rail crossings where you're house-hunting? Crossing maps and FRA records for 300 large U.S. cities: night trains, quiet zones and the busiest railroad lines.
FRA data retrieved November 9, 2026
Illustrative AI-generated landscape · not a photo of the searched property
- Most night trainsSan Antonio, TX · 93% of crossings
- Broadest quiet zonesSt. Louis, MO · 94% of crossings
- No quiet-zone crossings reportedLos Angeles, CA, Philadelphia, PA, Jacksonville, FL, Columbus, OH and 170 more
Largest cities
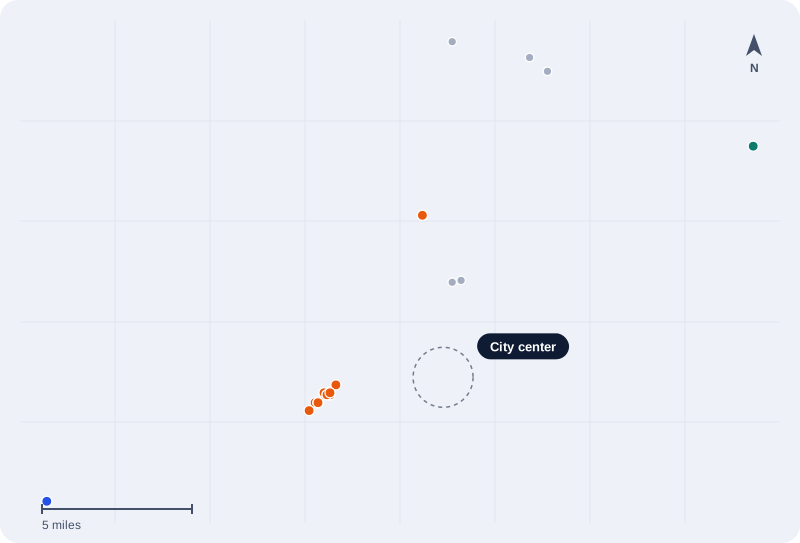
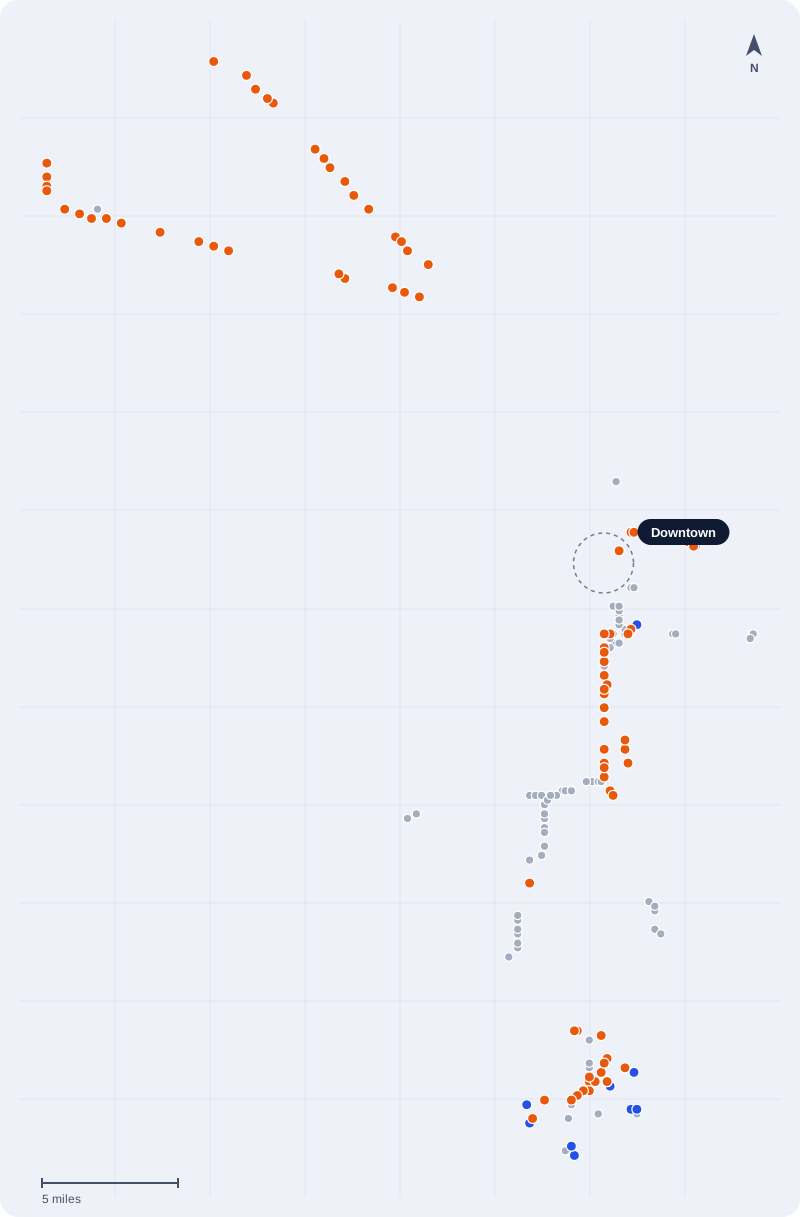
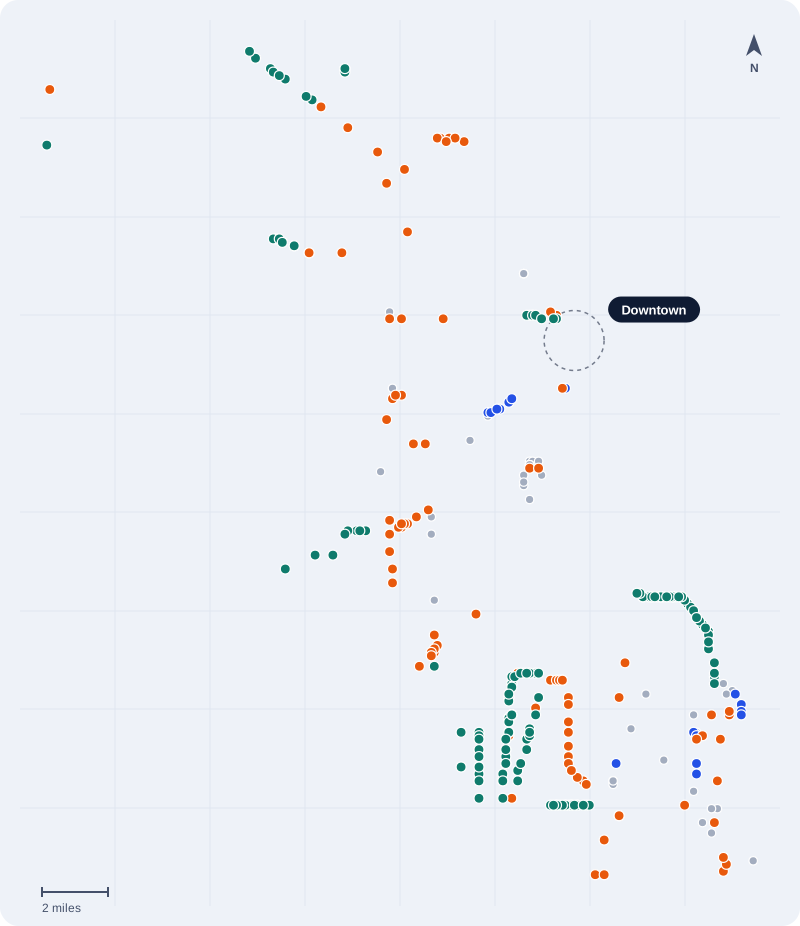
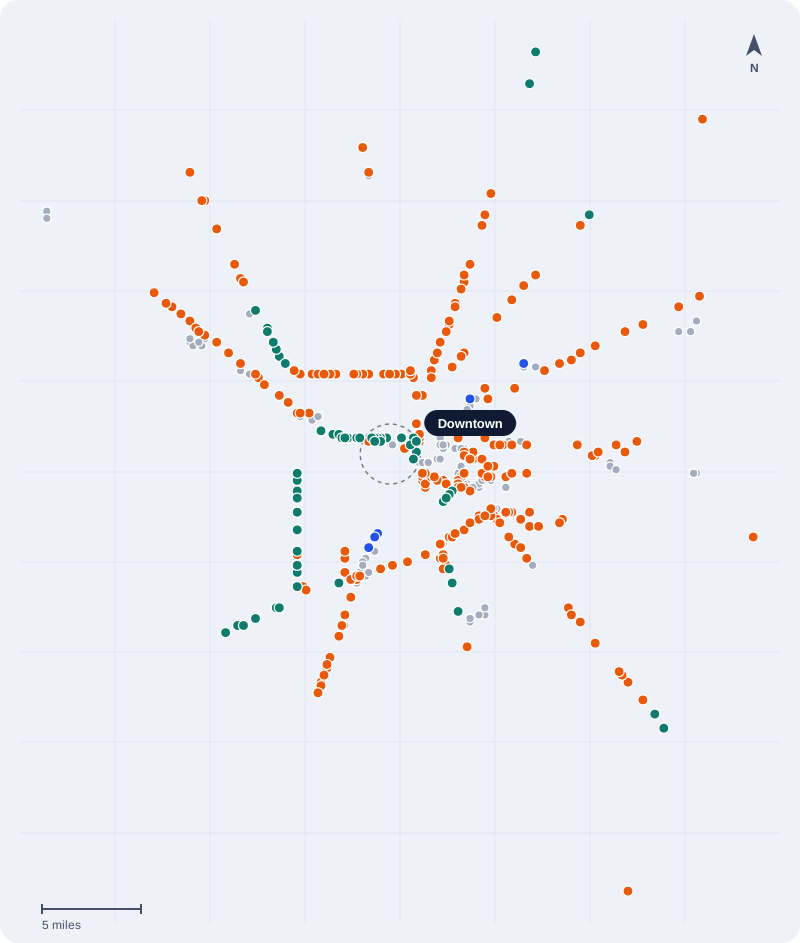
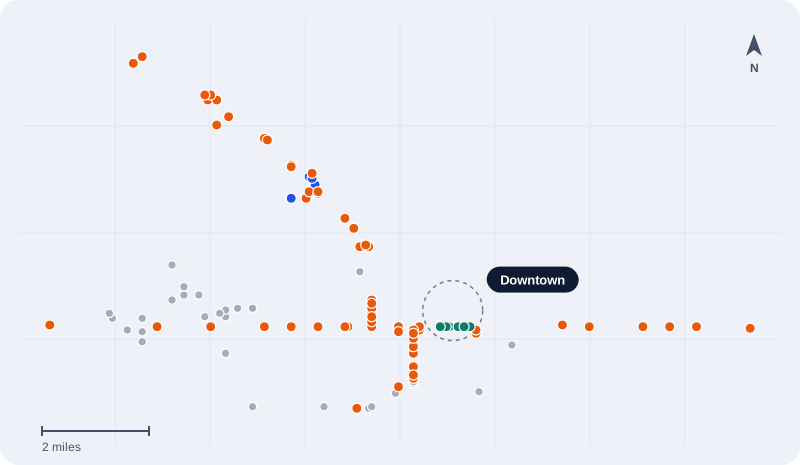
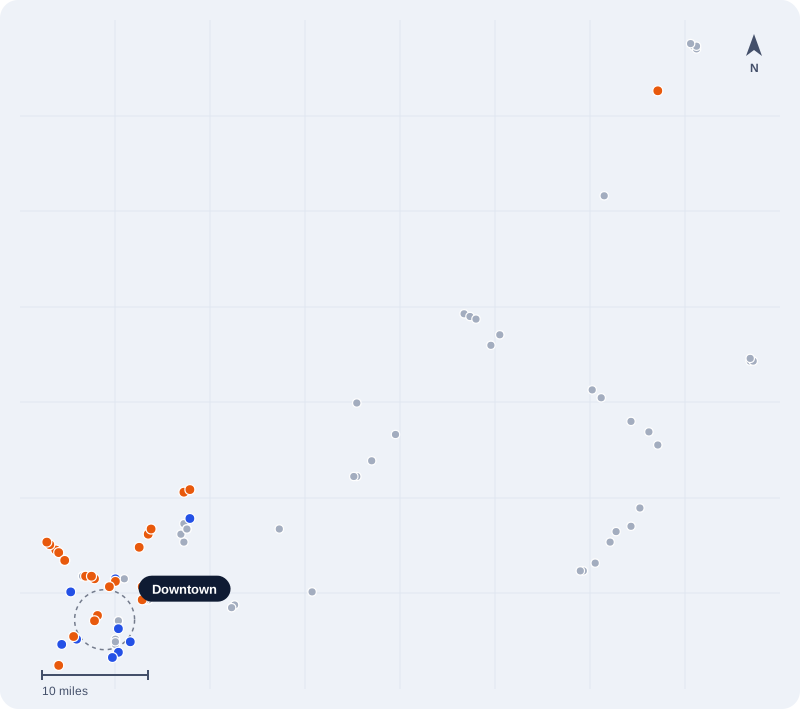
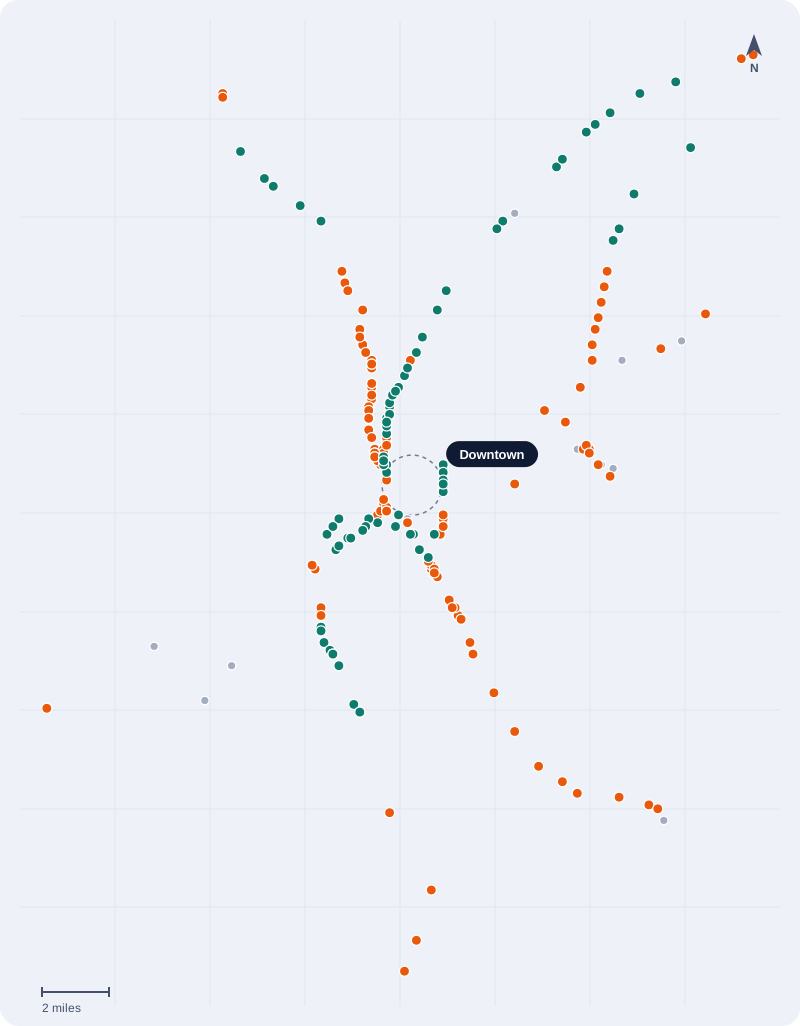
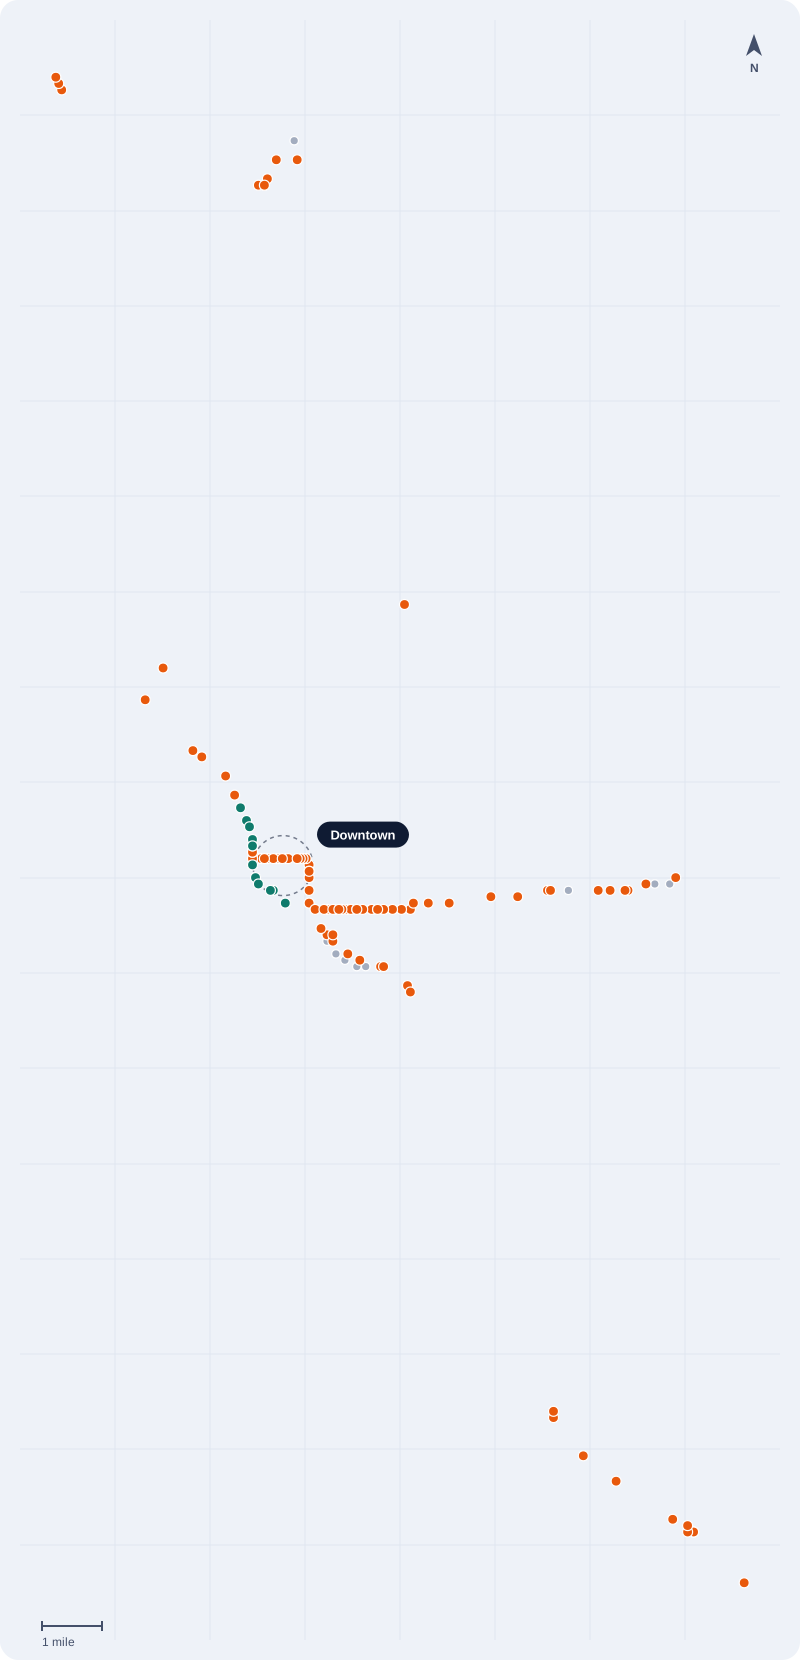
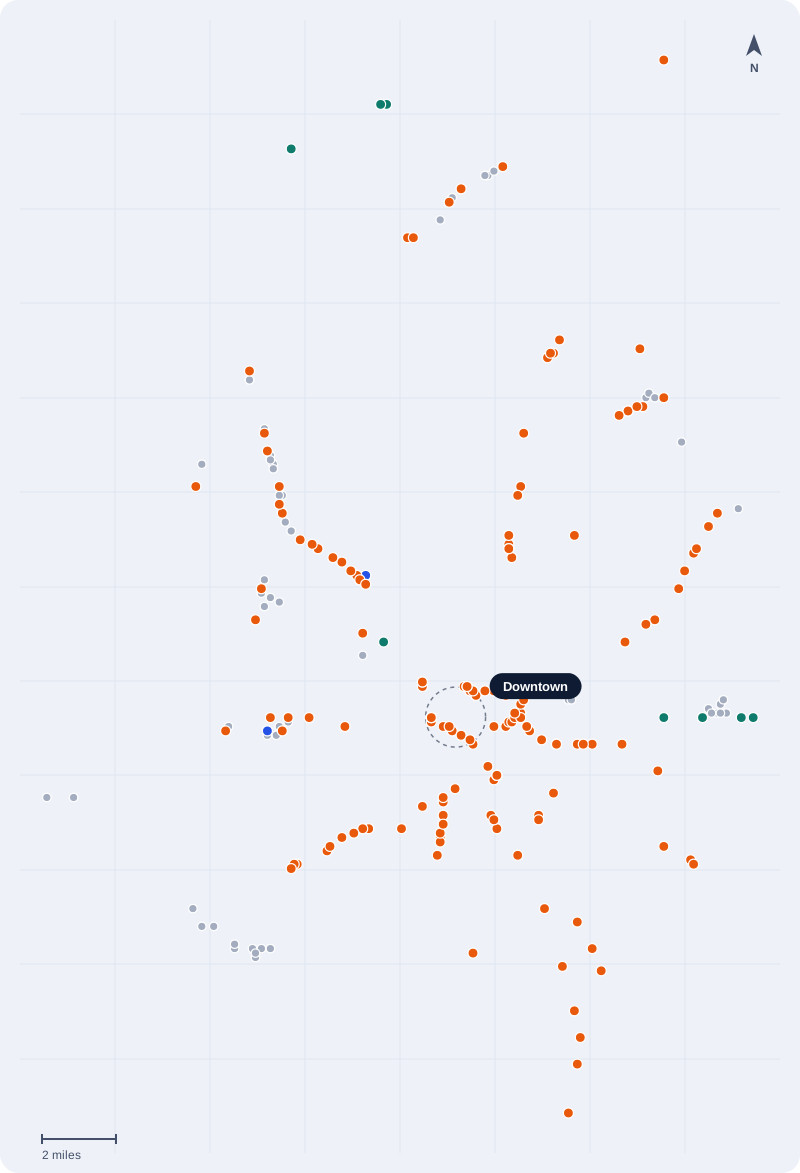
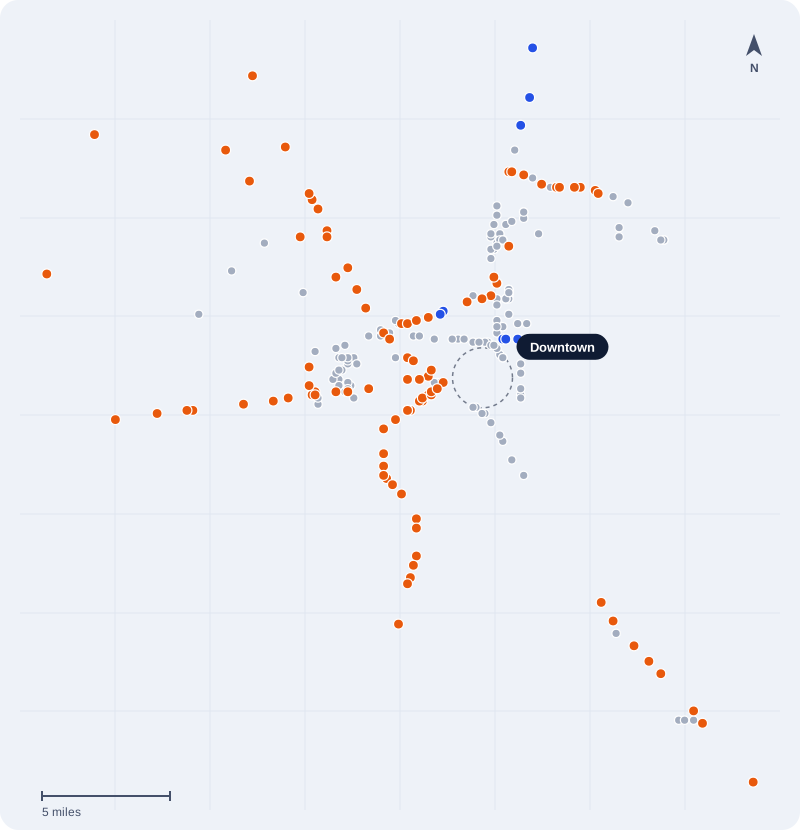
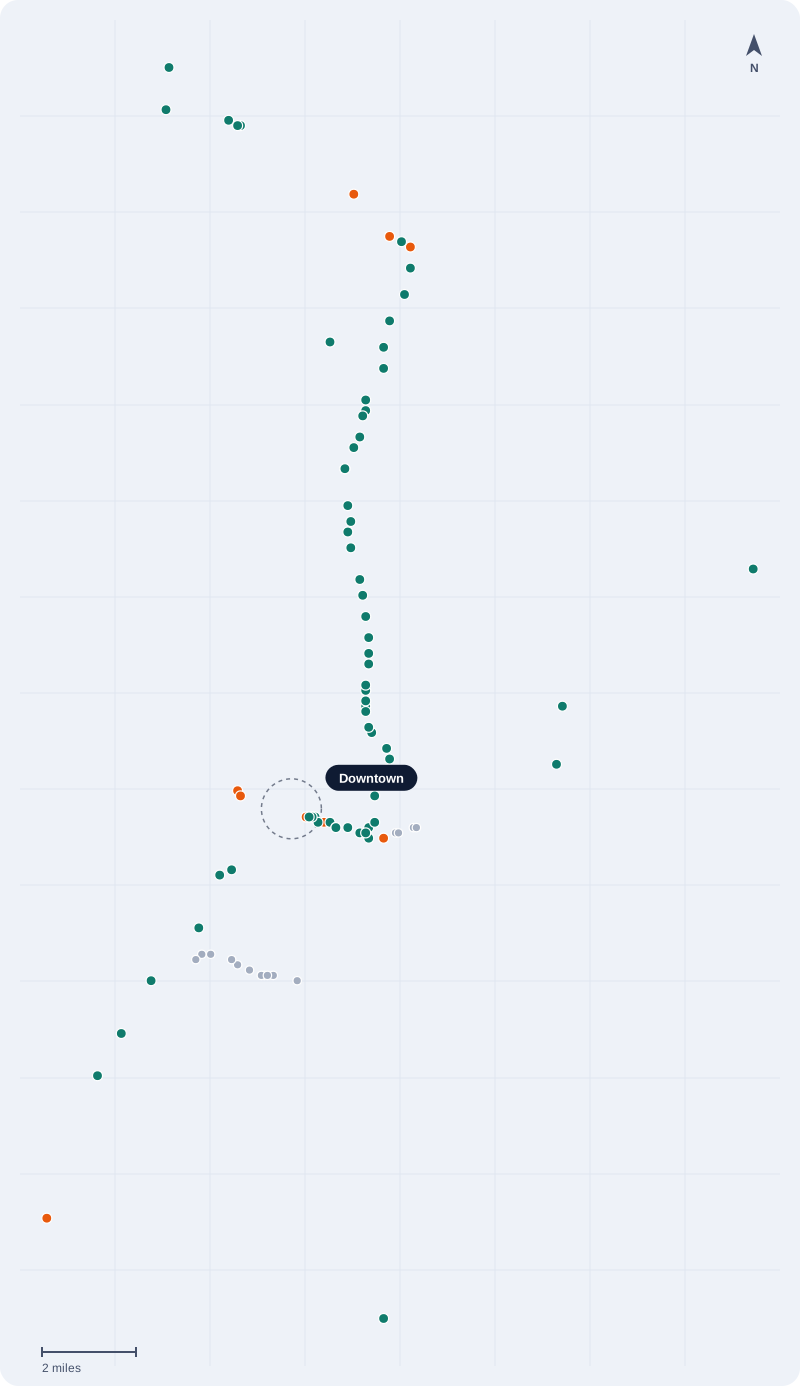
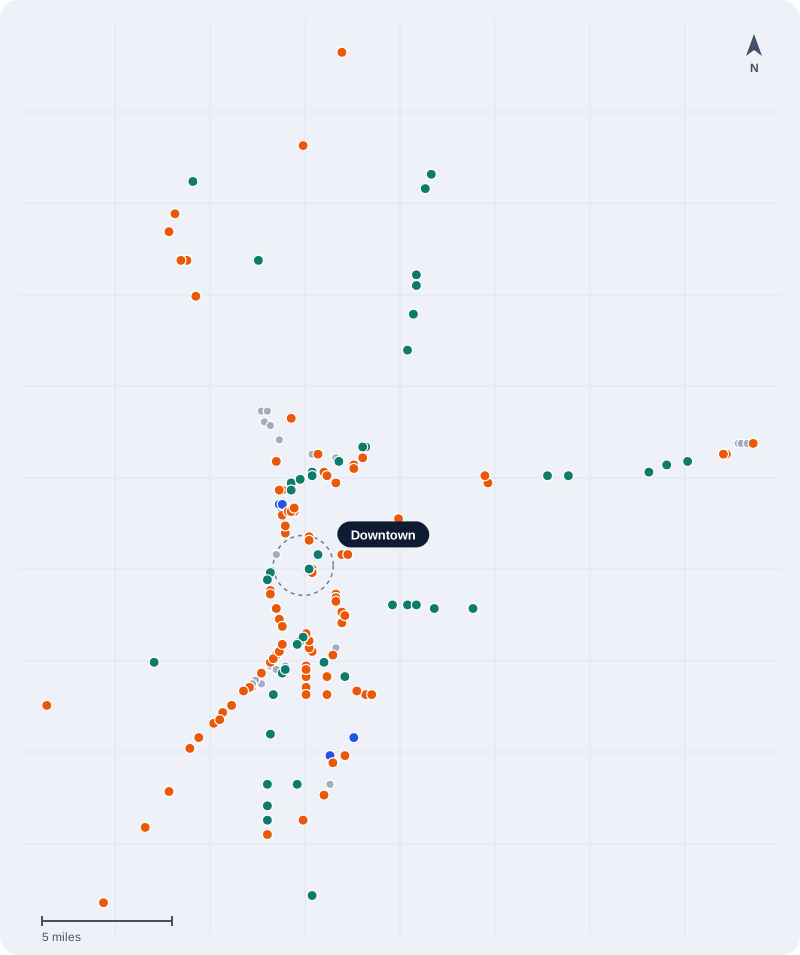
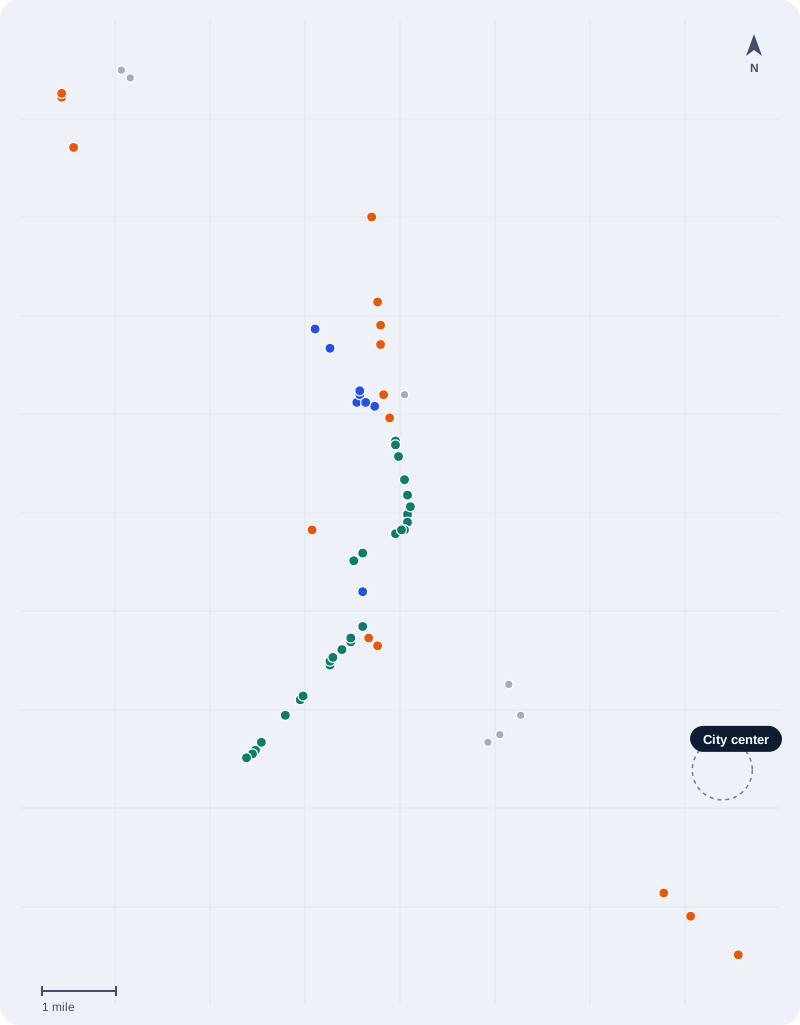
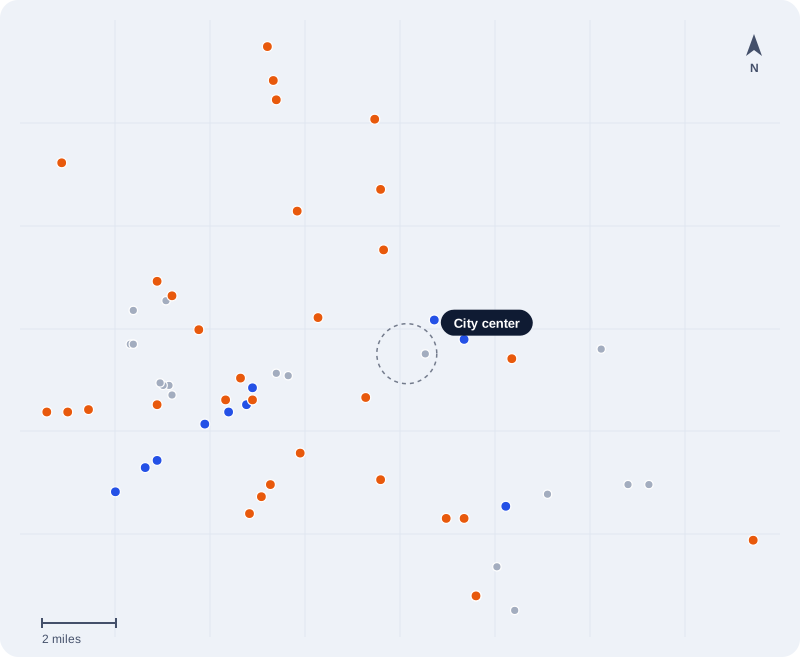
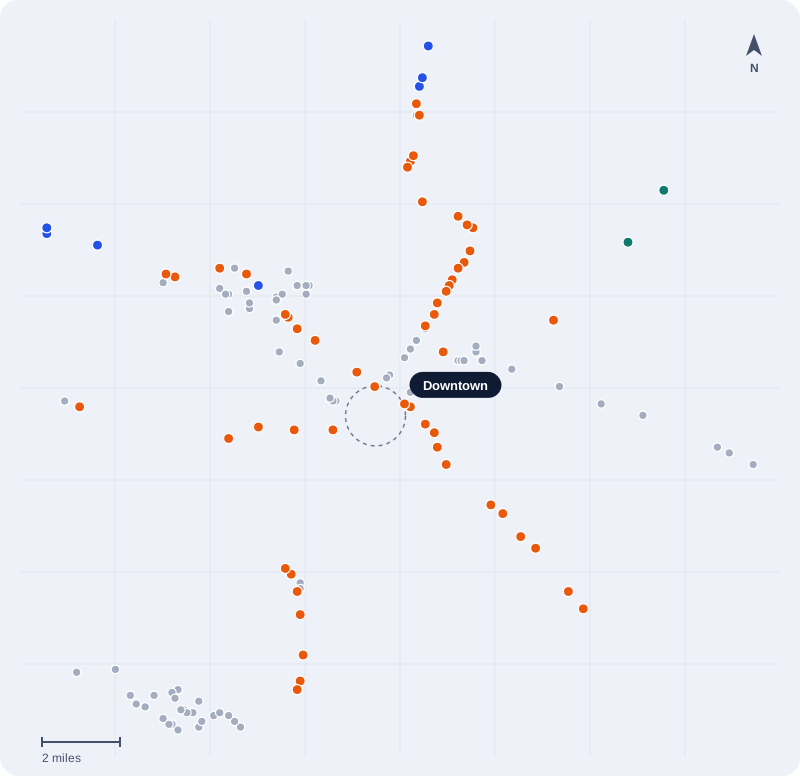
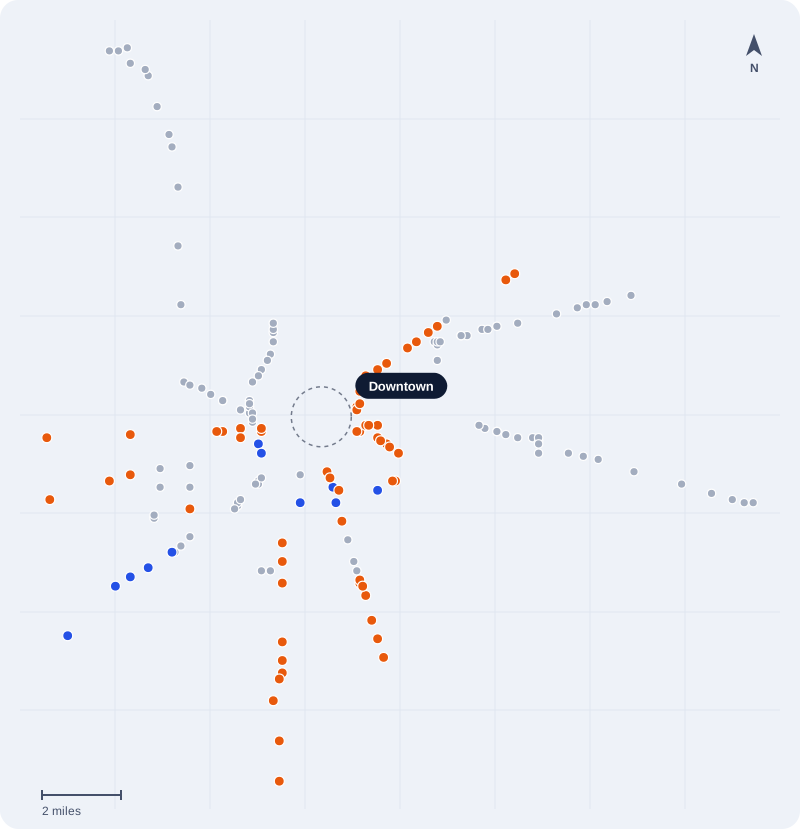
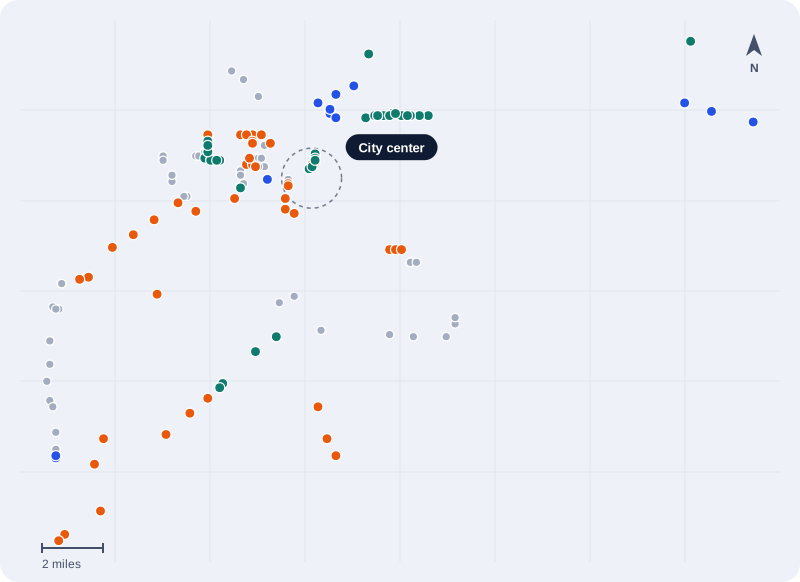
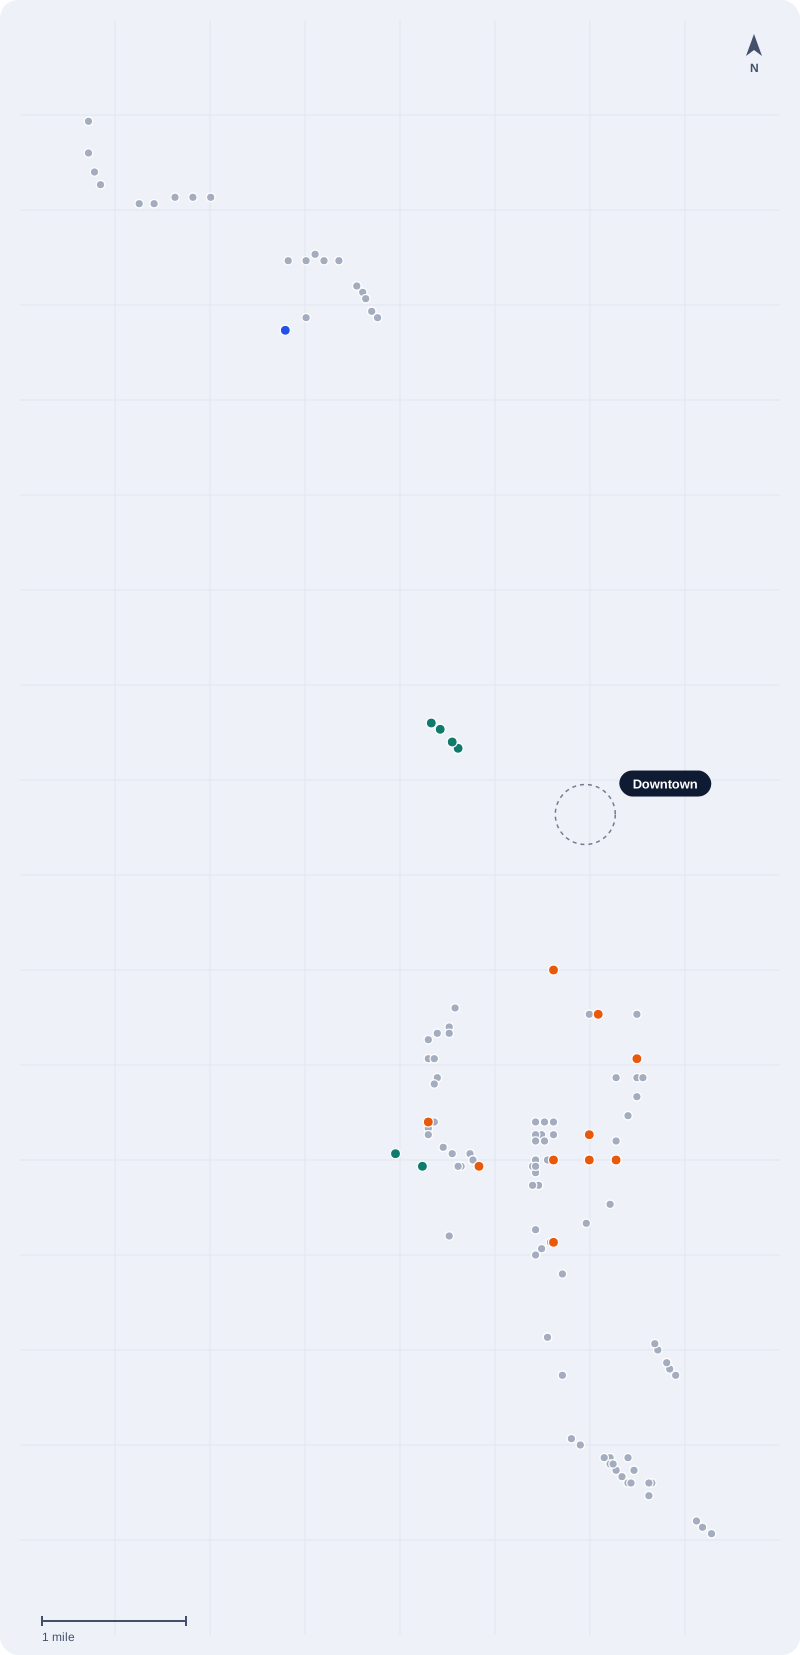
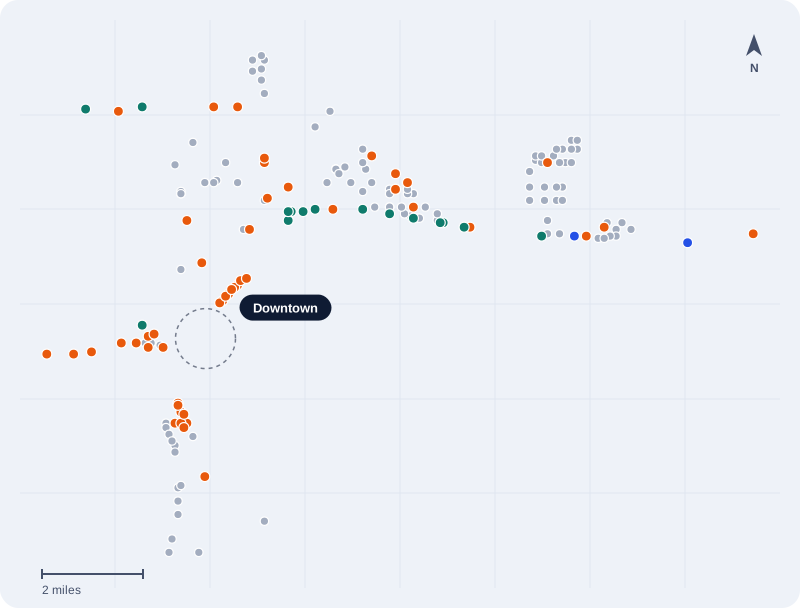
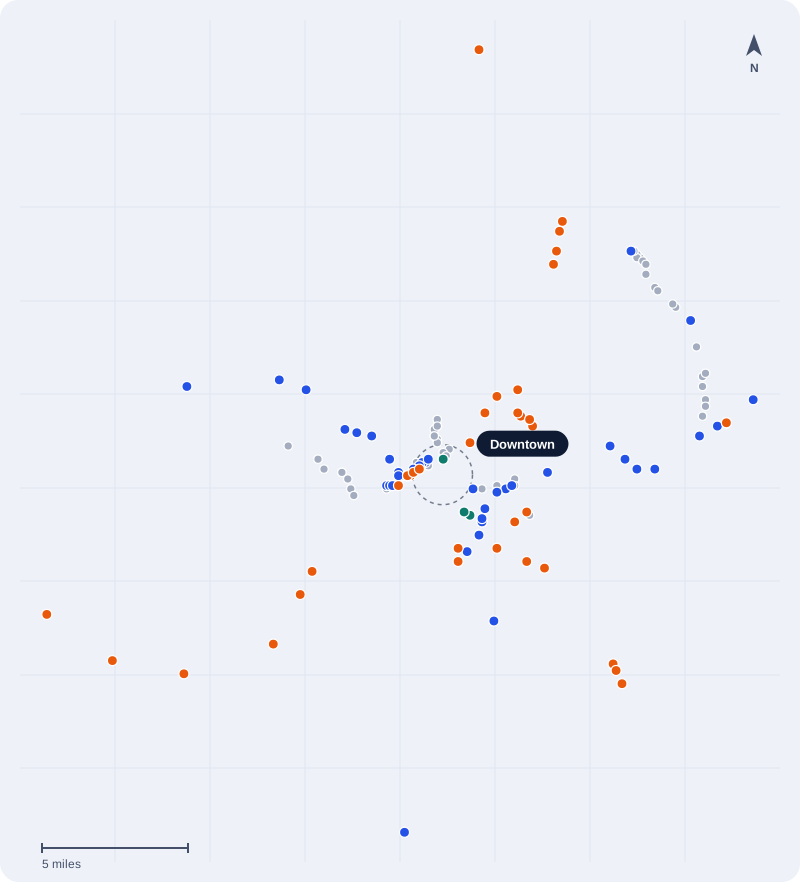
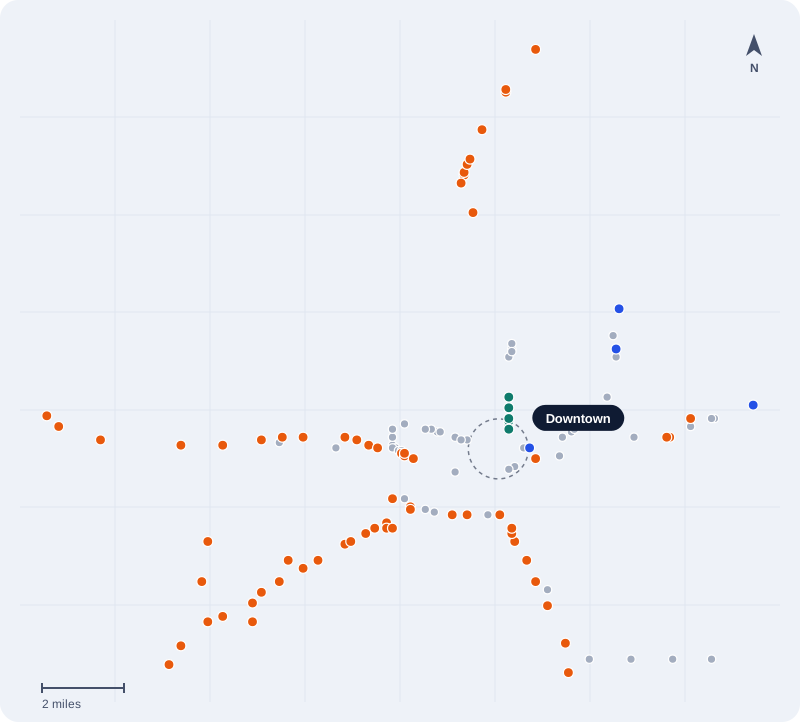
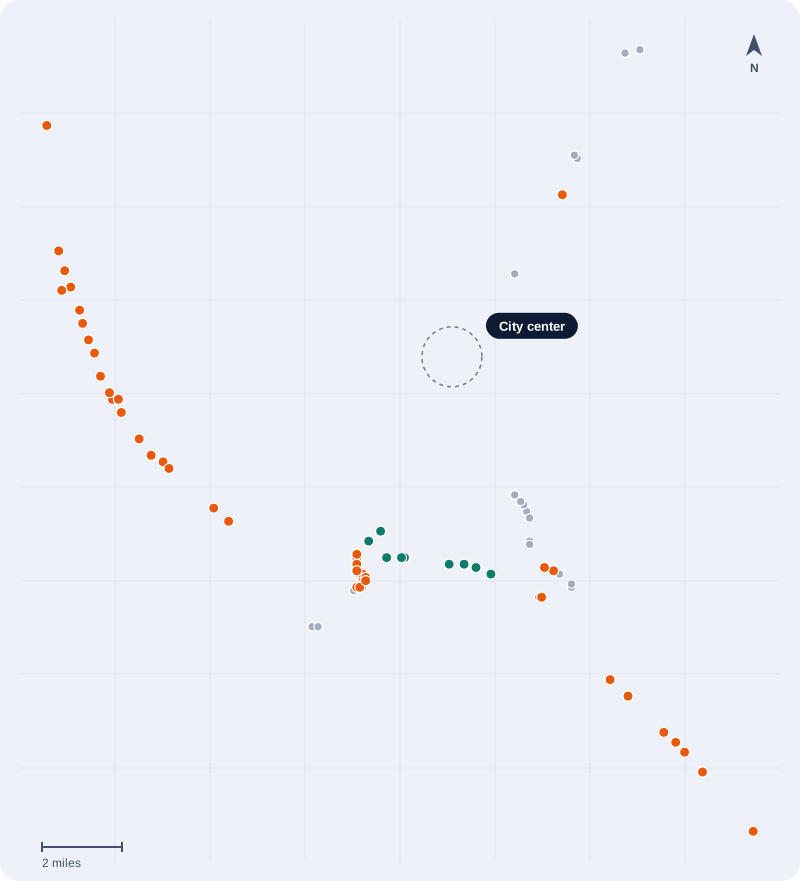
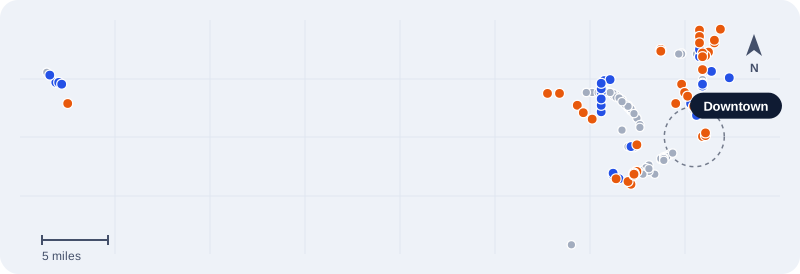
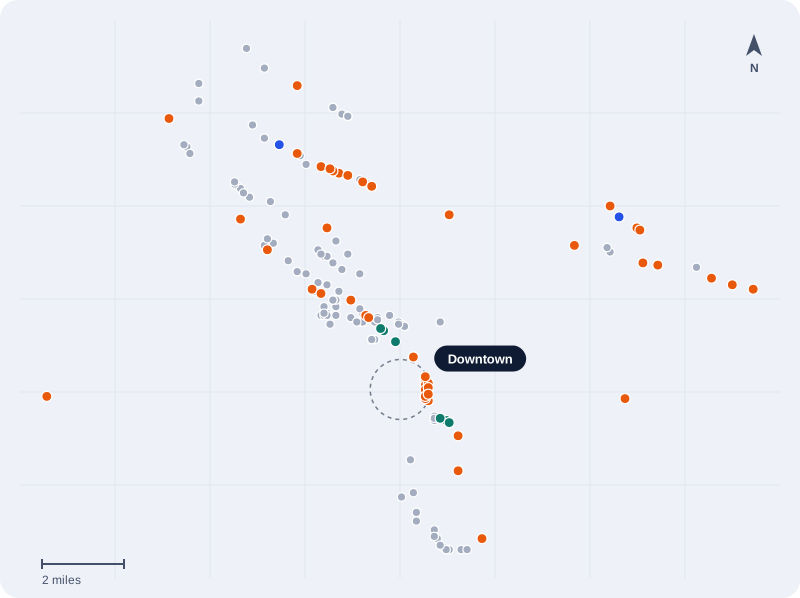
Orange dots report night trains outside a quiet zone; green dots are in a quiet zone.
All 300 cities by state
Cities with at least 15 public at-grade crossings and regular train traffic in FRA records.
Alabama 7
- Auburn15 crossings · 100% night
- Birmingham139 crossings · 59% night
- Dothan51 crossings · 33% night
- Huntsville46 crossings · 20% night
- Mobile83 crossings · 87% night
- Montgomery88 crossings · 25% night
- Tuscaloosa67 crossings · 76% night
Alaska 1
- Anchorage38 crossings · 50% night
Arizona 6
Arkansas 6
- Conway20 crossings · 80% night
- Fayetteville18 crossings · 44% night
- Fort Smith116 crossings · 12% night
- Jonesboro52 crossings · 90% night
- Little Rock54 crossings · 35% night
- Rogers30 crossings · 13% night
California 50
- Anaheim69 crossings · 23% night
- Antioch15 crossings · 73% night
- Bakersfield68 crossings · 97% night
- Chico22 crossings · 100% night
- Chula Vista21 crossings · 67% night
- Compton29 crossings · 62% night
- Folsom31 crossings · 35% night
- Fontana22 crossings · 36% night
- Fresno138 crossings · 79% night
- Hayward32 crossings · 25% night
- Hesperia19 crossings · 47% night
- Lodi40 crossings · 53% night
- Long Beach27 crossings · 22% night
- Los Angeles171 crossings · 47% night
- Madera28 crossings · 43% night
- Manteca17 crossings · 71% night
- Merced27 crossings · 93% night
- Modesto53 crossings · 91% night
- Napa26 crossings · 85% night
- Oakland89 crossings · 28% night
- Oceanside20 crossings · 100% night
- Ontario43 crossings · 35% night
- Orange22 crossings · 64% night
- Oxnard41 crossings · 17% night
- Palmdale20 crossings · 90% night
- Perris16 crossings · 56% night
- Pomona29 crossings · 45% night
- Rancho Cordova30 crossings · 43% night
- Redlands18 crossings · 100% night
- Redwood City27 crossings · 33% night
- Rialto19 crossings · 42% night
- Richmond44 crossings · 36% night
- Riverside48 crossings · 81% night
- Sacramento82 crossings · 61% night
- San Bernardino28 crossings · 96% night
- San Diego123 crossings · 81% night
- San Jose60 crossings · 75% night
- San Leandro36 crossings · 39% night
- San Marcos17 crossings · 82% night
- Santa Ana35 crossings · 31% night
- Santa Maria23 crossings · 91% night
- Santa Rosa21 crossings · 81% night
- South Gate19 crossings · 84% night
- Stockton134 crossings · 63% night
- Torrance22 crossings · 55% night
- Tracy43 crossings · 28% night
- Tulare47 crossings · 89% night
- Turlock53 crossings · 74% night
- Visalia65 crossings · 92% night
- Vista15 crossings · 100% night
Colorado 10
- Arvada26 crossings · 88% night
- Aurora47 crossings · 47% night
- Commerce City32 crossings · 53% night
- Denver174 crossings · 37% night
- Fort Collins56 crossings · 86% night
- Grand Junction16 crossings · 38% night
- Greeley20 crossings · 50% night
- Longmont36 crossings · 56% night
- Loveland25 crossings · 64% night
- Pueblo26 crossings · 73% night
Delaware 1
- Wilmington25 crossings · 32% night
Florida 18
- Clearwater33 crossings · 0% night
- Daytona Beach15 crossings · 100% night
- Delray Beach17 crossings · 100% night
- Fort Lauderdale29 crossings · 79% night
- Fort Myers44 crossings · 52% night
- Hialeah48 crossings · 38% night
- Hollywood16 crossings · 100% night
- Jacksonville236 crossings · 42% night
- Kissimmee28 crossings · 86% night
- Lakeland60 crossings · 45% night
- Melbourne23 crossings · 100% night
- Miami92 crossings · 32% night
- Ocala79 crossings · 28% night
- Orlando113 crossings · 40% night
- Pompano Beach21 crossings · 76% night
- Tallahassee25 crossings · 72% night
- Tampa180 crossings · 26% night
- West Palm Beach58 crossings · 90% night
Georgia 7
Idaho 4
- Boise City34 crossings · 0% night
- Caldwell33 crossings · 52% night
- Idaho Falls38 crossings · 29% night
- Nampa22 crossings · 55% night
Illinois 8
- Bloomington35 crossings · 91% night
- Chicago303 crossings · 80% night
- Decatur70 crossings · 74% night
- Elgin28 crossings · 86% night
- Joliet36 crossings · 69% night
- Peoria45 crossings · 76% night
- Rockford93 crossings · 40% night
- Springfield63 crossings · 89% night
Indiana 8
- Bloomington18 crossings · 67% night
- Evansville99 crossings · 35% night
- Fort Wayne41 crossings · 78% night
- Gary89 crossings · 74% night
- Hammond59 crossings · 76% night
- Indianapolis168 crossings · 36% night
- Lafayette26 crossings · 42% night
- South Bend44 crossings · 86% night
Iowa 5
- Cedar Rapids81 crossings · 69% night
- Davenport37 crossings · 65% night
- Des Moines78 crossings · 53% night
- Iowa City31 crossings · 26% night
- Sioux City56 crossings · 32% night
Kansas 5
- Kansas City78 crossings · 29% night
- Lawrence28 crossings · 82% night
- Olathe18 crossings · 83% night
- Topeka37 crossings · 70% night
- Wichita164 crossings · 55% night
Kentucky 3
- Bowling Green23 crossings · 74% night
- Lexington40 crossings · 23% night
- Louisville144 crossings · 57% night
Louisiana 5
- Baton Rouge113 crossings · 89% night
- Lafayette37 crossings · 89% night
- Lake Charles64 crossings · 55% night
- New Orleans125 crossings · 59% night
- Shreveport81 crossings · 60% night
Maine 1
- Portland36 crossings · 53% night
Maryland 1
- Baltimore103 crossings · 12% night
Michigan 7
Minnesota 6
- Bloomington26 crossings · 0% night
- Duluth63 crossings · 17% night
- Minneapolis81 crossings · 17% night
- Rochester35 crossings · 49% night
- St. Cloud28 crossings · 32% night
- St. Paul70 crossings · 24% night
Missouri 6
- Columbia17 crossings · 0% night
- Independence45 crossings · 62% night
- Kansas City98 crossings · 58% night
- Springfield93 crossings · 20% night
- St. Joseph41 crossings · 29% night
- St. Louis147 crossings · 67% night
Montana 1
- Billings52 crossings · 21% night
New Mexico 2
- Albuquerque65 crossings · 55% night
- Santa Fe23 crossings · 91% night
North Carolina 12
- Asheville29 crossings · 76% night
- Cary15 crossings · 73% night
- Charlotte139 crossings · 40% night
- Durham45 crossings · 56% night
- Fayetteville96 crossings · 15% night
- Gastonia45 crossings · 20% night
- Greensboro60 crossings · 55% night
- Greenville40 crossings · 40% night
- High Point27 crossings · 70% night
- Raleigh29 crossings · 59% night
- Wilmington48 crossings · 33% night
- Winston-Salem22 crossings · 36% night
Ohio 7
Oklahoma 5
- Broken Arrow16 crossings · 100% night
- Lawton35 crossings · 80% night
- Norman16 crossings · 100% night
- Oklahoma City125 crossings · 56% night
- Tulsa123 crossings · 45% night
Oregon 8
Pennsylvania 5
- Allentown17 crossings · 35% night
- Erie30 crossings · 43% night
- Philadelphia108 crossings · 26% night
- Pittsburgh37 crossings · 49% night
- Scranton29 crossings · 66% night
South Carolina 5
- Charleston30 crossings · 20% night
- Columbia82 crossings · 68% night
- Greenville55 crossings · 36% night
- North Charleston33 crossings · 36% night
- Rock Hill56 crossings · 63% night
South Dakota 2
- Rapid City37 crossings · 78% night
- Sioux Falls92 crossings · 15% night
Tennessee 7
- Chattanooga125 crossings · 16% night
- Clarksville22 crossings · 9% night
- Jackson44 crossings · 0% night
- Johnson City36 crossings · 67% night
- Knoxville123 crossings · 46% night
- Memphis160 crossings · 66% night
- Nashville133 crossings · 33% night
Texas 42
- Abilene36 crossings · 44% night
- Amarillo50 crossings · 76% night
- Arlington25 crossings · 32% night
- Austin88 crossings · 78% night
- Baytown49 crossings · 61% night
- Beaumont119 crossings · 83% night
- Brownsville29 crossings · 76% night
- Bryan41 crossings · 88% night
- Carrollton52 crossings · 71% night
- Conroe45 crossings · 100% night
- Corpus Christi45 crossings · 58% night
- Dallas224 crossings · 71% night
- Denton40 crossings · 93% night
- Edinburg17 crossings · 71% night
- El Paso73 crossings · 70% night
- Fort Worth177 crossings · 81% night
- Garland45 crossings · 71% night
- Grand Prairie40 crossings · 25% night
- Harlingen70 crossings · 86% night
- Houston424 crossings · 71% night
- Irving41 crossings · 76% night
- Laredo82 crossings · 94% night
- Lewisville18 crossings · 100% night
- Longview40 crossings · 63% night
- Lubbock97 crossings · 46% night
- McAllen39 crossings · 13% night
- Midland25 crossings · 64% night
- Mission48 crossings · 48% night
- New Braunfels46 crossings · 89% night
- North Richland Hills15 crossings · 93% night
- Odessa31 crossings · 52% night
- Plano33 crossings · 85% night
- Richardson21 crossings · 90% night
- Round Rock15 crossings · 53% night
- San Angelo52 crossings · 98% night
- San Antonio209 crossings · 93% night
- San Marcos33 crossings · 100% night
- Sugar Land16 crossings · 94% night
- Temple31 crossings · 84% night
- Tyler61 crossings · 90% night
- Waco34 crossings · 91% night
- Wichita Falls40 crossings · 33% night
Utah 3
- Provo16 crossings · 88% night
- Salt Lake City111 crossings · 43% night
- West Jordan22 crossings · 86% night
Virginia 7
- Chesapeake57 crossings · 56% night
- Lynchburg20 crossings · 30% night
- Norfolk46 crossings · 63% night
- Portsmouth26 crossings · 23% night
- Richmond68 crossings · 65% night
- Roanoke22 crossings · 82% night
- Suffolk47 crossings · 45% night
Washington 11
- Auburn18 crossings · 72% night
- Bellingham30 crossings · 57% night
- Kennewick51 crossings · 76% night
- Kent39 crossings · 36% night
- Marysville21 crossings · 100% night
- Seattle127 crossings · 12% night
- Spokane Valley28 crossings · 89% night
- Spokane69 crossings · 57% night
- Tacoma85 crossings · 22% night
- Vancouver30 crossings · 30% night
- Yakima84 crossings · 6% night
Compare the 50 largest cities
| City | Public crossings | Night trains | Quiet zone | Busiest railroad line (trains/day) | Incidents 2021–26 |
|---|---|---|---|---|---|
| New York, NY | 27 | 18 (67%) | 1 (4%) | 103 | 1 |
| Los Angeles, CA | 171 | 80 (47%) | 0 (0%) | 22 | 40 |
| Chicago, IL | 303 | 241 (80%) | 133 (44%) | 79 | 102 |
| Houston, TX | 424 | 302 (71%) | 64 (15%) | 47 | 145 |
| Phoenix, AZ | 102 | 69 (68%) | 7 (7%) | 12 | 51 |
| Philadelphia, PA | 108 | 28 (26%) | 0 (0%) | 10 | 9 |
| San Antonio, TX | 209 | 194 (93%) | 77 (37%) | 40 | 60 |
| San Diego, CA | 123 | 100 (81%) | 12 (10%) | Mostly transit | 39 |
| Dallas, TX | 224 | 160 (71%) | 8 (4%) | 35 | 40 |
| Jacksonville, FL | 236 | 99 (42%) | 0 (0%) | 32 | 37 |
| Austin, TX | 88 | 69 (78%) | 64 (73%) | Mostly transit | 14 |
| Fort Worth, TX | 177 | 144 (81%) | 47 (27%) | 28 | 41 |
| San Jose, CA | 60 | 45 (75%) | 28 (47%) | 116 | 13 |
| Columbus, OH | 59 | 31 (53%) | 0 (0%) | 51 | 8 |
| Charlotte, NC | 139 | 56 (40%) | 2 (1%) | 28 | 31 |
| Indianapolis, IN | 168 | 60 (36%) | 0 (0%) | 8 | 32 |
| Louisville, KY | 144 | 82 (57%) | 35 (24%) | 28 | 19 |
| Seattle, WA | 127 | 15 (12%) | 6 (5%) | 50 | 17 |
| Denver, CO | 174 | 65 (37%) | 15 (9%) | 28 | 35 |
| Nashville, TN | 133 | 44 (33%) | 4 (3%) | 16 | 29 |
| Oklahoma City, OK | 125 | 70 (56%) | 6 (5%) | 21 | 14 |
| El Paso, TX | 73 | 51 (70%) | 9 (12%) | 23 | 16 |
| Detroit, MI | 155 | 41 (26%) | 0 (0%) | 29 | 27 |
| Portland, OR | 168 | 55 (33%) | 6 (4%) | 30 | 15 |
| Memphis, TN | 160 | 105 (66%) | 6 (4%) | 32 | 63 |
| Baltimore, MD | 103 | 12 (12%) | 0 (0%) | 110 | 17 |
| Milwaukee, WI | 84 | 28 (33%) | 2 (2%) | 36 | 5 |
| Albuquerque, NM | 65 | 36 (55%) | 17 (26%) | 28 | 3 |
| Tucson, AZ | 28 | 25 (89%) | 0 (0%) | 40 | 8 |
| Fresno, CA | 138 | 109 (79%) | 14 (10%) | 34 | 28 |
| Sacramento, CA | 82 | 50 (61%) | 33 (40%) | 44 | 9 |
| Atlanta, GA | 49 | 25 (51%) | 1 (2%) | 51 | 34 |
| Kansas City, MO | 98 | 57 (58%) | 3 (3%) | 100 | 11 |
| Omaha, NE | 57 | 32 (56%) | 0 (0%) | 18 | 3 |
| Raleigh, NC | 29 | 17 (59%) | 0 (0%) | 21 | 5 |
| Miami, FL | 92 | 29 (32%) | 24 (26%) | 70 | 35 |
| Long Beach, CA | 27 | 6 (22%) | 0 (0%) | Mostly transit | 0 |
| Oakland, CA | 89 | 25 (28%) | 0 (0%) | 62 | 40 |
| Minneapolis, MN | 81 | 14 (17%) | 68 (84%) | Mostly transit | 6 |
| Bakersfield, CA | 68 | 66 (97%) | 7 (10%) | 28 | 27 |
| Tulsa, OK | 123 | 55 (45%) | 5 (4%) | 28 | 16 |
| Tampa, FL | 180 | 46 (26%) | 1 (1%) | 9 | 15 |
| Arlington, TX | 25 | 8 (32%) | 7 (28%) | Mostly transit | 3 |
| Wichita, KS | 164 | 90 (55%) | 0 (0%) | 30 | 17 |
| Aurora, CO | 47 | 22 (47%) | 1 (2%) | Mostly transit | 9 |
| New Orleans, LA | 125 | 74 (59%) | 3 (2%) | 27 | 15 |
| Cleveland, OH | 73 | 34 (47%) | 0 (0%) | 45 | 7 |
| Anaheim, CA | 69 | 16 (23%) | 14 (20%) | Mostly transit | 2 |
| Orlando, FL | 113 | 45 (40%) | 35 (31%) | Mostly transit | 7 |
| Lexington, KY | 40 | 9 (23%) | 0 (0%) | 29 | 5 |
“Busiest railroad line” excludes light rail and transit-agency crossings. Night trains are reported between 6 PM and 6 AM.
How these numbers were built
Records come from the FRA Crossing Inventory (Form 71, current): open, public, at-grade crossings whose inventory city matches each city (including records reported as near the city). Incident totals use FRA Form 57 accident reports from January 2021 to August 2026. Train counts are railroad-reported estimates with varying count years, not schedules. See how to read train counts and data coverage and limits.
City totals are a starting point.
What one house hears depends on the nearest crossing, its night traffic and whether horns are restricted there.